
Bar Graph Display & Indicator in Sydney

Join industrial buyers comparing supplier quotes and buying with confidence. Free, quick and easy.

How IndustrySearch works
Tell us what you need
Answer a few quick questions about the equipment you're looking for.
Get personalised quotes
Receive tailored quotes from relevant Australian suppliers.
Compare and choose
Compare quotes, ask questions and choose the best option for you.
 Save time
 Compare quotes
 Buy with confidence
Save time, compare quotes & buy with confidence
Bar Graph Display & Indicator Suppliers in Sydney

Innovec Controls is an Bar Graph Display & Indicator supplier to Sydney
Innovec Controls is Solutions That Work. We can offer products that will do what you want, when you want. Whether it be counting bottles on a production line, flow measurement, a fuel gauge or a fuel interlock on a CNG Vehicle, LED lighting for trains & trams, we can supply. We also solve unusual applications by Bespoke design to your specific requirements. We manufacture ...Customers: transport NSW bombardier transportation, UGL, Progress Rail Australia, Progress Rail USA,
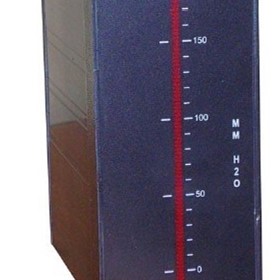
Innovec BGI100 Powered Bar Graph Process Indicator
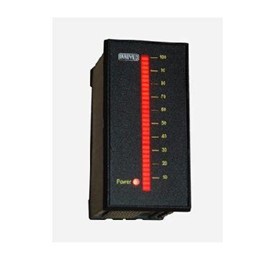
Powered Bar Graph Process Indicator BGI
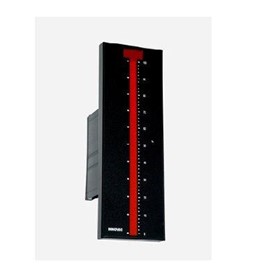
Powered Bar Graph Process Indicator BGI051

- Size: The size of the display should be appropriate for the application and the viewing distance.
- Resolution: The resolution of the display should be high enough to provide clear and accurate readings.
- Brightness: The brightness of the display should be adjustable to suit the lighting conditions of the environment.
- Color: The color of the display should be chosen based on the application and the user's preferences.
- Input signal: The display should be compatible with the input signal from the sensor or instrument.
- Accuracy: The accuracy of the display should be high enough to provide reliable readings.
- Response time: The response time of the display should be fast enough to provide real-time readings.
- Durability: The display should be durable enough to withstand the environment and the application.
- Power consumption: The power consumption of the display should be low enough to minimize energy costs.
- Business: Bar graphs are used to represent sales data, market share, and financial data in business presentations and reports.
- Education: Bar graphs are used to represent student performance, attendance, and grades in academic reports.
- Healthcare: Bar graphs are used to represent patient data, such as blood pressure, heart rate, and temperature, in medical reports.
- Engineering: Bar graphs are used to represent data related to production, quality control, and process improvement in manufacturing.
- Environmental Science: Bar graphs are used to represent data related to pollution levels, climate change, and natural resource management.
- Sports: Bar graphs are used to represent data related to player performance, team statistics, and game results in sports analysis.
- Social Sciences: Bar graphs are used to represent data related to demographics, crime rates, and economic indicators in social science research.
- Viewing distance: The viewing distance will determine the size of the display. If the display is too small, it may be difficult to read from a distance.
- Available space: The available space will also determine the size of the display. If you have limited space, you may need to choose a smaller display.
- Amount of data: The amount of data you need to display will determine the number of bars on the graph. If you have a lot of data, you may need a larger display with more bars.
- Resolution: The resolution of the display will determine how clear the data is. If you need to display detailed information, you may need a higher resolution display.
- Budget: The cost of the display will also be a factor. You should choose a display that fits your budget while still meeting your requirements.
- Power supply: The bar graph display and indicator may require a specific voltage and current rating for proper operation. Ensure that the power supply meets the manufacturer's specifications.
- Mounting: The display and indicator may need to be mounted securely to a panel or enclosure. Check the mounting instructions provided by the manufacturer.
- Wiring: The display and indicator may require wiring to connect to the power supply and any other devices in the system. Follow the wiring diagram provided by the manufacturer.
- Environmental conditions: The display and indicator may have specific requirements for temperature, humidity, and other environmental factors. Ensure that the installation location meets these requirements.
- Calibration: The display and indicator may need to be calibrated to ensure accurate readings. Follow the calibration instructions provided by the manufacturer.
- Calibrate the instrument: Before using the instrument, calibrate it according to the manufacturer's instructions. This will ensure that the readings are accurate.
- Check the range: Make sure that the range of the instrument matches the range of the measurement you are taking. If the range is too high or too low, the readings may be inaccurate.
- Check the resolution: The resolution of the instrument should be appropriate for the measurement you are taking. If the resolution is too low, the readings may not be precise enough.
- Check the display: Make sure that the display is clear and easy to read. If the display is blurry or difficult to read, the readings may be inaccurate.
- Check for interference: Make sure that there is no interference from other sources that could affect the readings. This could include electromagnetic interference or other environmental factors.
- Calibration: The indicator should be calibrated periodically to ensure that it is accurate and reliable. This can be done using a calibration tool or by comparing the readings to a known standard.
- Inspection: The display and indicator should be inspected regularly for signs of damage or wear. Any damaged or worn parts should be replaced immediately to prevent further damage.
- Power supply: The power supply for the display and indicator should be checked regularly to ensure that it is functioning properly. Any issues with the power supply should be addressed immediately to prevent damage to the display or indicator.
Bar Graph Display & Indicator Costs and Supplier Insights
If you are looking to buy a Bar Graph Display & Indicator for sale, suppliers on IndustrySearch include Innovec Controls
Why choose a supplier in Sydney for Bar Graph Display & Indicator Quotes?
If you are in Sydney and considering purchasing a Bar Graph Display & Indicator, it's worth considering Sydney-based suppliers. Doing so offers several benefits that are particularly relevant to businesses in the area. Here are the top reasons why opting for a local Sydney supplier can be the best decision for your Bar Graph Display & Indicator buying needs.
Local Suppliers are the Key to Supply Chain StrengthMake local Bar Graph Display & Indicator suppliers in Sydney key your supply chain strength. Depend on them for quick replenishments and steady supplies.
On-Site Bar Graph Display & Indicator Support and TrainingBenefit from on-site support and training in Sydney. Having access to immediate help and expertise ensures your team uses the equipment effectively.
Partner with Sydney Suppliers for ComplianceChoose local suppliers as your compliance partners. Their expertise ensures that all products meet local regulations, giving you peace of mind.
Custom Solutions from Sydney SuppliersGet Bar Graph Display & Indicator solutions that meet your exact needs from local suppliers. Tailor-made products ensure maximum efficiency and satisfaction.
Sydney Providers Leading Innovation AdoptionChoose Sydney Bar Graph Display & Indicator providers leading in innovation adoption. They help you implement the latest industry trends swiftly, enhancing your operational capacity.
Economical Purchasing in SydneyMake economical decisions by purchasing your Bar Graph Display & Indicator from Sydney. Save on transport and import duties, reducing overall procurement costs.
Buy a Bar Graph Display & Indicator Near Me
Bar Graph Display & Indicator Articles & Reviews


 Reach valuable industrial buyers in minutes
 Promote key products & content
 Drive cost effective & measurable sales